Runtime memory profiling and more for Delphi with the new TMS MemInsight

TMS MemInsight v1.0
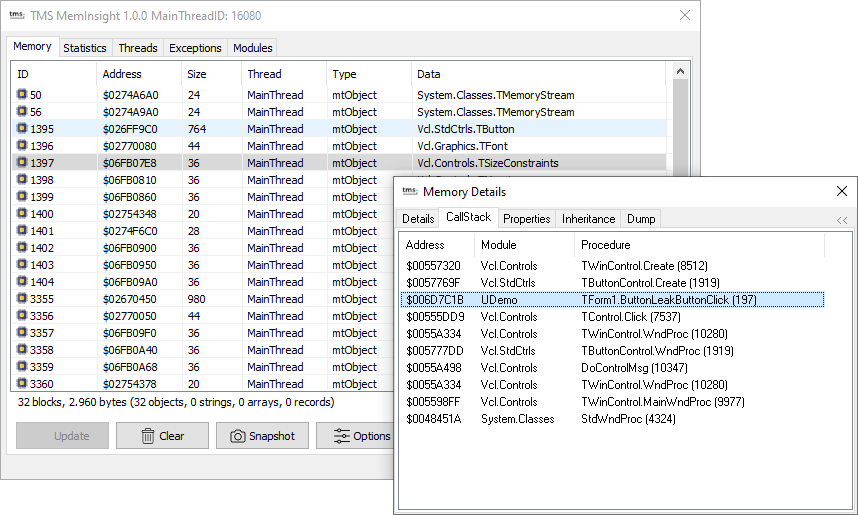
Whereas most memory allocation tracking tools are static, that is producing a report on application close or upon application crash, the difference with TMS MemInsight is that it is a dynamic memory allocation profiling tool that is used at run-time. This means that also while your application is running without issues, you can monitor where there are possibly performance issues due to consuming huge amounts of memory.
With TMS MemInsight, you can continuously inspect memory allocation during run-time and get information on classes for which memory is allocated and get the class info, call stack, thread, property inspection, memory dump etc… of everything. With a statistics view, it is easy to see where the majority of allocated application memory is going to. When you run the tool in debug mode with a map file, it is able to directly bring you to the position in the source code in the Delphi IDE of where memory was allocated.

Getting started
Discover it also for yourself in this video:
What’s next
We have plenty of ideas of possible future directions of not only the TMS MemInsight tool but also new complimentary tools. But of course, as always, it is your wishes and requests for specific functionality that steer our development priorities. We look forward to hear from you what enhancements can be done in TMS MemInsight to make your development even easier and what other development tools you further wish. Contact us by email or leave a comment here.


