The InterBase VAR program is here to help you take your ideas from paper to market. We know one size doesn’t fit all and each solution is unique; that is why the VAR Program exists. VARs can embed InterBase with their applications with a “silent install” and pay for licenses periodically as they are distributed. This licensing option and volume license discounts are possible by setting up a VAR agreement. Follow along with this video to learn more about how you can become an InterBase VAR and how you can make money from this ultra-fast, scalable, high-performance, robust and modern database system while giving your clients and company the best quality cross-platform solution available.
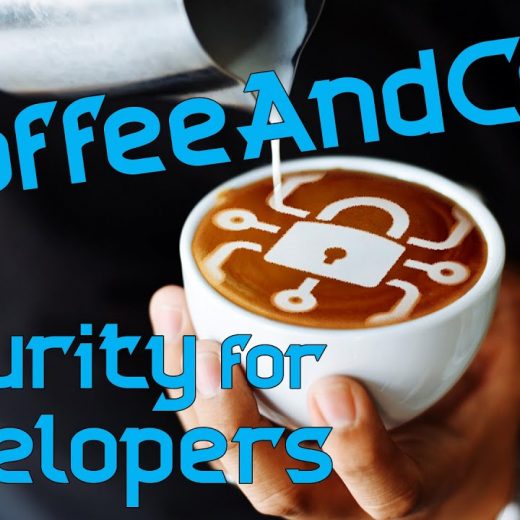
Security should always be the top-most priority whether you are the developer of an application or the end-user. In this TCoffee and Code session, Embarcadero MVPs Jim McKeeth, Ian Barker, Charles Anderson, Zach Briggs, and Glenn Dufke have a 2-hour-long conversation which entirely focuses on security. The topic highlights a comprehensive developer’s guide to security. Here, they address everything from Supply Chain Risk such as ‘poisoned’ APIs and SDKS to the danger of dealing with cracked software. Security isn’t just stopping hackers; it’s API and SDK and supply-chain security too. This great collection of very experienced developers also tackle the proper way of dealing with and understanding your libraries and the most effective ways to prevent your data from being hacked or compromised due to many risk factors. The discussion highlights important security-related topics including password protection, biometric systems, application security, regulatory compliance, encryption, and other equally important security-related windows app development tools. The Do’s and Don’ts Of Security. How to learn from their experiences and what you should know. For software developers, designers and managers, this conversations also focuses on the Do’s and Don’ts when designing and developing software. They guide us through the right way to develop an application safely and securely and how to write secure code. The team also focus on how to protect data whether it is a movement or at rest as well as securing your interactions with the development platform and how to deploy your project securely. Why not grab a coffee and join in the conversation? If you want to know more about security and its crucial role in software development, feel free to watch this TCoffee and Code session below and learn from this relaxed and fact-filled developer conversation over some coffee and, of course, code.
Sometimes your application needs a user interface, but what is the best way to make one for Python applications? Is it using Python Windows GUI builder? The answer, quite emphatically, is DelphiVCL for Python. What is the Delphi VCL for Python? The VCL is a mature Windows native GUI framework with a huge library of included visual components and a robust collection of 3rd party components. It is the premier framework for native Windows applications, but how can you use it with Python? Why you should use the DelphiVCL Python Package Thanks to the DelphiVCL Python package, the VCL is a first-class package for building native Windows GUIs with Python. Need more design tools? You can build the entire GUI in Delphi and then write all the logic in Python. DelphiVCL is the fastest, most mature, and complete GUI library for native Windows Python GUI development. Watch this video for everything you need to know about DelphiVCL
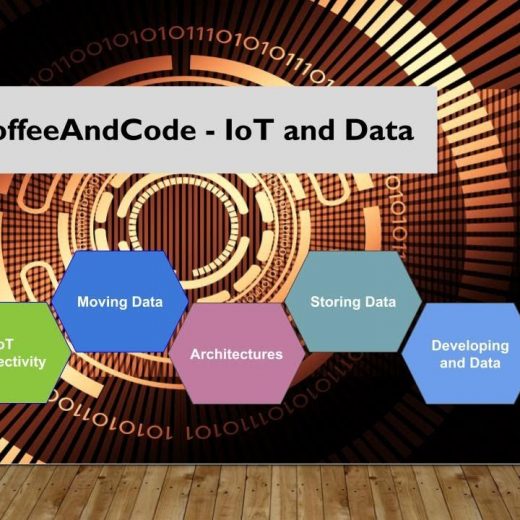
Due to the ongoing pandemic, most of our developers had to embrace the new normal working environment. Interestingly, Embarcadero came up with a brilliant idea to organize a weekly virtual coffee break meeting ~ the TCoffee and Code that will gather most of our amazing developers to discuss various topics related to the industry including Delphi, windows program development, and more. They will also answer different queries from their followers. The future of the internet could be the internet of things In this particular TCoffee and Code session, a team of developers will discuss everything about the IoT (Internet of Things) and Data. This session was led by the co-inventor of the IoT Award-winning technology Change Views, Stephen Ball as well as Jim McKeeth, and Marco Cantu. Here, they will dive into some of the technologies helping with the movement of data within the IoT space. The Internet of things (IoT) describes the network of physical objects that are embedded with sensors, software, and other technologies for the purpose of connecting and exchanging data with other devices and systems over the Internet. Open the pod bay doors Today, IoT is rapidly transforming how we do business and live our daily lives and this brilliant team of developers discuss everything from how this concept started to the amazing things we can expect from it in the future. This hour-long virtual discussion also covers topics like where to process data, IoT connectivity, moving data, modern architectures, data Storage and software development. To learn more about IoT and Data, feel free to watch this TCoffee and Code session below.
Face recognition is identifying or confirming the identity of a person using their face. It’s something we humans do from a very early age and we take that process almost for granted. We can do this either in person, using a photo, video, or even a painting or drawing, assuming it’s accurate enough. Getting a computer to perform the same function, though, is an immensely complicated task. In order to have any true success in true facial recognition, recognizing specific faces, rather than the location or area where a face is located, requires artificial intelligence. Will Microsoft Cognitive Services API built with Native Windows Development recognize faces? Let’s find out all the answers in this post! The controversy of recognizing faces As more systems have entered the market with the ability to recognize people’s faces, people began to experience some of the positive benefits, such as the ability to verify the user’s identity when unlocking a smartphone or when carrying out sensitive actions such as accessing a banking app. Before too long law enforcement agencies also began to see how they too might be able to benefit from using this technology to identify wanted criminals or to spot a potential terrorist in a crowded airport. Stopping terrorist attacks and solving crime is of course something we all want. However, like all biometrics, face recognition is not a perfect technology. The face is much more likely to change over time and can also be easily obscured, intentionally or otherwise, with things like masks, hats, and facial hair. Why is facial recognition so popular around the world? Other biometric systems like fingerprints and iris scanners can also have challenges that affect their accuracy too, but less so than that of the face. Despite this, facial recognition has some benefits which might make it a good choice – for example, it is contactless, can be used from a significant distance, can be used to recognize persons of interest even if they are no longer physically present, for example via a video recording. Facial recognition is also passive, which means you don’t need the co-operation of the people whose faces you are recognizing. The downside to that, of course, is that it can be abused by agencies or countries to track their citizens in aid to suppression of their rights, or to keep automated and possibly wide-ranging surveillance of people a government or organization might which to oppress or subjugate. False negatives or positives can lead to legal troubles Another downside of face recognition is that it can be “false negative” or “false positive”. False-negative is the situation in which the face recognition system failed to find the matching face from the database even though the database has a matching face. False-positive is the situation in which the system matches a face from a database even though the database doesn’t have any matching face. This can depend on the technology used by face recognition but even organizations with substantial technical resources can apparently make mistakes in recognition. Ultimately it’s the developer’s responsibility to choose and understand the appropriate technology for the use-case of the application they develop. What is the technology behind face recognition? The technology behind face recognition is getting a mathematical representation of the face. It uses the distance between eyes and […]
Due to the current pandemic, webinars have become the newest form of interactive tech convention. Embarcadero Technologies, who were already way ahead of the curve on this, recently added to their great diversity of online webinars, tutorials and how-to streams with an informal virtual meeting where developers discuss various topics related to Delphi, windows program development, and the tech industry in general. TCoffeeAndCode is packed with great advice and is completely free TCoffee and Code is a hugely popular virtual meeting series where each session highlights different topics. In this video, Embarcadero MVPs like Marco Cantu, Ian Barker, Zack Briggs, Anders Ohlsson, Glenn Dufke, Dave Akerman, and Jim McKeeth gathered together to discuss everything about Delphi and its huge impact. The session also highlighted an interesting discussion on how to do business with a Delphi Consultant and they even tackled an interesting dating guide for software developers. This 2-hour-long video session also discusses WideOrbit and why the company uses Delphi. They also tell us how they hire Delphi developers and what tools and components they use for their products and services. How to do business with Delphi and earn an income with it The team also shares their thoughts about how and how much the project should be priced. They also discuss how software estimation works and how it can help the developer approach their client to get the right price for the project. The video will also highlight Delphi’s involvement in NASA’s 2020 Mars Perseverance Rover. If you want to learn more about the huge impact of Delphi you really should watch the video!
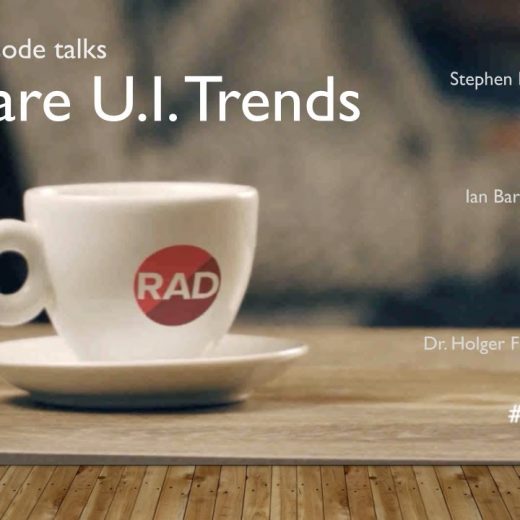
Modern hardware and constantly changing fashions in user interfaces can be tough to keep up with. Graphics cards available today are many times more powerful than even those from just a few short years ago. Even the platforms on which our applications run have become more diverse and it’s common for your users to have a combination of ways to interact with data; from desktop, web and mobile. The excellent TCoffeeAndCode webinar series is here to help In this TCoffee and Code session, Embarcadero MVPs Stephen Ball, Ian Barker, and Dr. Holger Flick (TMS Software) will discuss everything about windows ui toolkit and the latest Software UI trends. They tackled about three of the most common and most popular graphical user interface designs including the so-called Skeuomorphism, Neomorphism, and Flat UI. Skeuomorphism is a UI design that mimics their real-world counterparts in how they appear and/or how the user can interact with them while Neomorphism is one of the newest UI trends that features a minimal and real-looking design that’s sort of a new take on skeuomorphism. Everything you need to know about modern user interfaces The Flat UI, on the other hand, is also a minimalistic design that tends to use limited but bold colors for fewer distractions. The simplicity of this design also promotes efficiency and functionality. The session also covers other related topics including Fluent UI and Project Reunion. They will also discuss how the aforementioned User Interface designs are interrelated and how does device form impacts modern UI designs. With TCoffeeAndCode you get to ask the questions and get the answers you need – and it’s all free The team also answers multiple queries like how do components help with software UI trends and how much VCL styles help with this modern UI. They will also share their thoughts if it is advisable to get a professional graphic designer to help with the design or just let the developer design it himself. If you want to learn more about the latest software UI trends today, feel free to watch this TCoffee and Code session below.
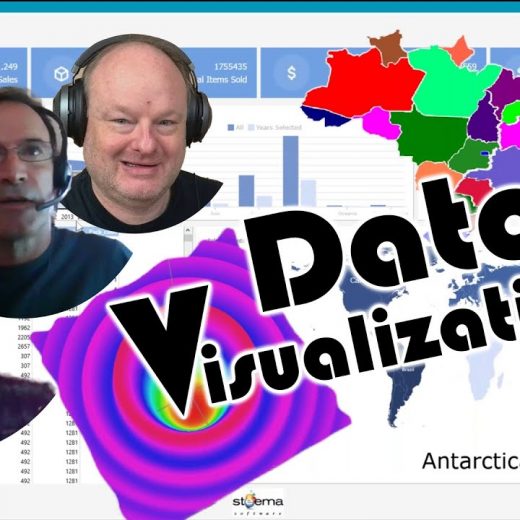
In this post TCoffee and Code is back for another interesting conversation. Joining Jim McKeeth are his fellow Embarcadero MVPs Ian Barker, David Intersimone, and Marc Meumann of Steema Software to discuss everything about data visualizations, the importance of it, the components, tools, libraries, and other windows app development tools that you can use for visualizations. What is Data Visualization? In this video, we will learn about the generality of Data visualizations and we will get to witness some live demonstrations using various components and libraries. David Intersimone, for instance, shares how a TEDtalk from Hans Rosling (the founder of Gapminder) inspired him in his data visualization journey. By using visual elements like charts, graphs, maps, and data visualization tools provide an accessible way to see and understand trends, outliers, and patterns in data. As Ian describes it, “data visualization is the art of taking something useful and making it beautiful”. Visualization Components, Libraries, Tools, and Services Along with this webinar, David I also provided a blog post summary that contains all the information, tools, and useful links about data visualizations. Generally, the webinar discusses how to visualize data and make it look good. They provide an extensive list of components and libraries you can use for data visualization. These include but are not limited to VCL, FireMonkey, TeeChart, Canvas for drawing, Python4Delphi, and more. The same thing goes with tools like Gapminder and other reliable sources of data (World Bank, US Census, etc.) A Live Walkthrough of Visualizing Data Interestingly, the webinar guides us through data visualization using a live demo. We’ll get to see Steema Software’s TeeChart library and the list of components it has to offer. They also give us a quick overview of Gapminder tools for data visualization including the interactive Bubble chart from Hans Rosling’s TEDtalk. To learn more about data visualization, feel free to watch the webinar below.
In this webinar conducted by Embarcadero Technologies, Jim McKeeth was joined by Marc Hoffman of RemObjects Software to discuss everything about WebAssembly and the use of RemObject’s Oxygene programming language to bridge with Delphi. RemObjects Software is a software company founded in 2002 that develops and offers a great number of libraries and windows tools for developers. What is WebAssembly? This webinar explains WebAssembly and how it differs from JavaScript. Jim McKeeth describes WebAssembly as “an evolution of JavaScript” while Hoffman considers it as an excellent alternative for JavaScript. Generally, WebAssembly is a new type of code that can be run in modern web browsers and provides new features and major gains in performance. WebAssembly or simply Wasm is designed to be an effective compiler for source languages like C, C++, Rust, and more. Oxygene Language This one-hour-long webinar tackles RemObject’s very own Oxygene Programming language and how it differs from other modern programming languages today. Interestingly, Oxygene is a unique programming language based on Object Pascal that can import Java, C#, and Swift APIs from the runtime of the target operating system. A Walkthrough to RemObjects Element Compiler The video will also walk us through RemObjects Element Compiler. Here, Marc Hoffman demonstrates the use of their Element Compiler tool for the WebAssembly platform where we will get a quick overview of its main structure. They will also answer various queries from their attendees. To learn more about WebAssembly and to how use it with Delphi and the Element compiler, feel free to watch this webinar below. Why not download a free trial of Delphi today?
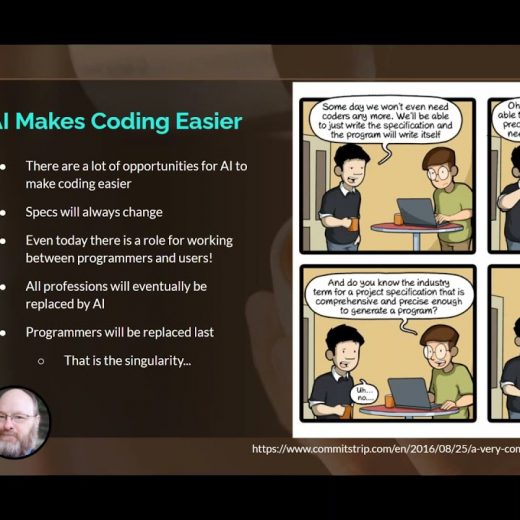
Technology is rapidly evolving and before we know it, there will be a new set of innovative gadgets or machines available in the market. We are currently embracing a new digital age where artificial intelligence is no longer a product of various science fiction novels but a real-life technology. Everything you need to know about Artificial Intelligence, Machine Learning, and Deep Neural Networks In this new TCoffee and Code session, Jim McKeeth was joined by his fellow Embarcadero MVPs Boian Mitov, Craig Chapman, Serge Pilko, and Yilmaz Yoru to discuss everything about Artificial Intelligence, Machine Learning, and Deep Neural Networks. We will also learn how all of these are changing the way we develop windows software. Does the rise of AI mean mankind is doomed? Here, they share their thoughts and opinions about the future of Artificial Intelligence and how it can drastically change the future. They also discuss how AI can manage to make coding relatively faster and how possible for this innovative technology to eventually replace all professions. They also made several references from Isaac Asimov’s Three Laws of Robotics as well as the possibilities of robot singularities in the future. In addition to that, they will also differentiate the differences between an AI and AGI as well as various types of Classifiers. What are Deep Neural Networks? The discussion will also highlight Deep Neural Networks and how this technology managed to simulate how the human brain works. They will also discuss RPA or Robot Processes Automation and how this becomes an effective new approach for business software on how to use all AI technologies. To top it all, the team will also share their thoughts about Machine Learning and its future. To know more about AI and Machine Learning, feel free to watch the video below.
Invormațiile pe cale Dvs le introduceți în prezentul formular nu se păstrează online, dar se vor transmite direct la destinație. Mai multe informații găsiți în Politica Noastră de Confidentialitate
We use cookies to ensure that we give you the best experience on our website. If you continue to use this site we will assume that you are happy with it.