A bug in certain versions of PostgreSQL, called the use-after-free bug, can cause segmentation faults. If you are affected, you should upgrade. The affected PostgreSQL versions are: PostgreSQL 12 versions earlier than 12.7. The bug was patched in PostgreSQL 12.7. PostgreSQL 13 versions earlier than 13.3. The bug was patched in PostgreSQL 13.3. Which versions of GitLab could be affected? GitLab EE versions 14.9 and later are affected, if your version of PostgreSQL is an affected version. GitLab CE versions 15.1 and later are affected, if your version of PostgreSQL is an affected version. Omnibus GitLab instances using a bundled PostgreSQL server are not affected as they ship with patched versions of PostgreSQL, and no further action is needed. We strongly recommend all instances using an affected PostgreSQL version to upgrade to the latest minor version for PostgreSQL version 12 or 13. For more detailed information, review our issue on this problem. “External PostgreSQL 12.7- and 13.3- servers used with GitLab should be upgraded to the latest minor version.” – Yannis Roussos Click to tweet Sign up for GitLab’s twice-monthly newsletter
eCommerce platform provider Swell was built to give entrepreneurs the opportunity to build the online business that they envision. A GitLab customer since 2021, GitLab has been adopted as Swell’s one DevOps, project management, and support ticketing tool for the whole organization. It’s the foundational platform that the business works on. Swell is using GitLab Premium in many different areas, including for product development and to build the platform infrastructure, says Nico Bistolfi, vice president of technology. “GitLab is our source of truth for everything,” Bistolfi says. Now, Swell is looking into expanding its usage of the platform to leverage features such as code quality, automation, and other types of dynamic application security and static application security. GitLab for CI/CD Swell upgraded to the Premium version and the biggest advantage so far has been the review operations capability, Bistolfi says. The company has created environments for every merge request users make, and that replicates in production for testers to see what was changed, whether a fix was made, or how the new feature is working. “We could not go to our software development lifecycle today without the review ops. That’s something that is critical for us,” Bistolfi says. GitLab is used for both continuous integration (CI) and continuous deployment (CD). While building the CI/CD pipeline process is ongoing, Bistolfi says, “We are slowly changing it and relying more and more on GitLab” in areas, including application security. Before moving to GitLab, Swell was using bare-metal servers. The company now uses GitLab’s container management solutions and all API updates are happening through the platform. From inputting issues to resolution Everyone at Swell is using GitLab — not just developers — and for a variety of tasks. The company has created a way to process support tickets through the platform. Another use case is knowledge management. “We find ourselves making some decisions from comments in GitLab,” he says. The whole process from the time a ticket is created to being resolved is done within the platform. The company culture is about full information transparency, Bistolfi says, particularly since Swell is fully remote and employees work from 11 different countries. So one goal is to maintain asynchronous communication. When an issue is created in the platform, a little bit of coding is required, but he said non-developer users have adapted well. The feedback so far has been that using GitLab has been frictionless. Speed to delivery Initially, for some services, it took about 30 minutes to build and deploy an image. Now, the process has been decreased to between one and five minutes in most cases. Swell manually sets release dates for system improvements and, right now, there are about two a week. The company is working on automating the process for continuous delivery with the goal of soon having releases every couple of hours. Team play Swell manages team backlogs, sprints, milestones, and future work using its own flavor of Kanban with what Bistolfi calls “quick labels.” Engineering teams are being scaled and, in addition to Kanban, some projects are done using Scrum. Changing their GitLab configuration has let teams measure velocity better. A future goal is to gain visibility into team results, as well as use GitLab for project planning and management, he says. GitLab as a product and company Bistolfi […]
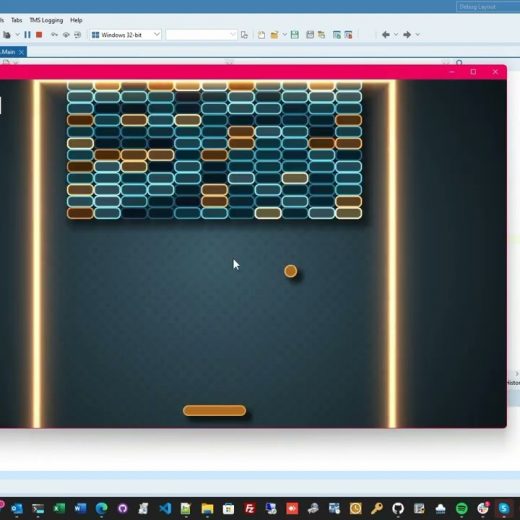
Picking the best User Interface framework for any windows application development is important and is beneficial for both developer and end-user. There is also a great number of third-party libraries in Delphi that you can use to level up your VCL or FMX apps and make them more visually appealing. Skia is probably one of the most powerful open-source 2D graphics libraries available today that provides a comprehensive 2D API that can be used across mobile, server, and desktop models to render images. We can also recall how Ian Barker managed to build a replica of the Star Trek data dashboard interface (LCARS) using the Skia4Delphi components. What else Skia4Delphi can do? Skia4Delphi is a fast-moving project under very active development and the possibilities of creating amazing interfaces using its powerful library are seemingly limitless. In this video which is an excerpt from the recently concluded Skia4Delphi webinar, we will get to see a demo showing what exactly Skia4Delphi is capable of. In this demo, we’ll see an interactive game similar to the classic Breakout game from the 80s. The sample comes with a simple form that contains TSKAnimatedPaintBox, one of the main components of Skia4Delphi. What makes it even more impressive is that the app only involves a few lines of codes. To top it all off, this Brick Game is a FireMonkey project! This means that this application can instantly work with multiple platforms such as Windows, macOS, Android, and iOS. To learn more about this amazing project that is done in Delphi using the Skia4Delphi library, feel free to watch the video below.
Data is the biggest asset for any business. It can help enterprises better understand their customers. It also improves their advertising campaigns and personalizes their content. However, you cannot access these benefits without proper analytics and reporting tools. While raw data has a lot of potential, a business needs data analytics and reporting too. This article will cover why analytics and reporting tools are essential. We will also see how businesses can use these to improve their performances. But before that, let’s understand the difference between data analytics, reporting, and picturing. What is the difference between data Analytics and reporting tools for visualization? Data analytics refers to examining data sets to conclude the information they contain. It is a technique that enables a business to take raw data to extract valuable insights from it. Data visualization is a term used to represent data through typical graphics. It uses charts, plots, animations, and infographics to represent data. These visuals display information that communicates complex data affairs. It also shows data-driven insights that are easy to grasp. Data reporting is the process of collecting and formatting raw data. It also includes translating it into a clear format to assess the ongoing performance. This data can then be used to answer basic questions about the state of a business. Why analytics and reporting tools for visualizations are essential for businesses What are data analytics? Data analytics is generally used to help companies better understand their customers. It also helps in personalizing content and creating content strategies. With analytics, businesses evaluate their ad campaigns and develop products. Generally, businesses use data analytics to boost performance and improve their worth. The data can include historical or new information businesses get for a particular initiative. The sublime example of data analytics is segmentation. It is used to help segment audiences by different demographic groups and analyze attitudes and trends. The businesses can then produce more specific, accurate, and just snapshots of public opinion. What do we mean by data visualizations? Data visuals are essential for businesses that want to communicate information clearly and efficiently. It is an advanced step in data analysis and data science. As per the report of Vitaly Friedman (2008), business groups use data visuals. They use it as an essential component of assertive connection. Visuals make research and data analysis effective and quicker. It does so by combining user-friendly and pleasing features. The best example of data picturing is making an institution’s budget. Budget numbers that are otherwise obscure and tough can be made simple and digestible with data visuals. This can then be delivered to the members to estimate the budget better. Why is data reporting important? Data reporting is essential when measuring the progress of every area of a business group. It informs professional decisions and day-to-day matters at any company. A data report is also essential to prioritize business tasks. It tells where a company should spend most of its time and resources and what needs more attention. The prime example of data reporting is business intelligence (BI) in healthcare. With its help, physicians can save lives by providing more effective and efficient patient care. Once you know why data analytics, reporting, and visuals are essential for business. Let’s understand how companies can improve their processes using analytics and […]
The energy and the enthusiasm was overwhelming. We are more than grateful for attending our webinar and we hope you enjoyed the experience. For those who want to see the live webinar again, a replay is available on our YouTube channel. For those who are hungry for more, we invite you to participate in our upcoming webinars.
Last time, we looked at many possible customizations for Tabulator and other parts of a TMS WEB Core Project that were generally focused on the “look” of the application. This included a handful of customizations to the content and format of the tables, as well as to other elements like images, fonts, and buttons. The overall theme was changed a few times, resulting in the styling we have now, with a handful of CSS customizations to tweak every little detail. This time out, we’re going to dig a bit deeper into the “feel” of the application. Interacting with various elements, particularly with Tabulator, breathing a little more life into the application. Motivation. While there are many JavaScript grids available that work great within TMS WEB Core projects, and even when considering elements beyond grids and projects beyond TMS WEB Core, there are aesthetic properties (what we can see) but also interactive properties (what we can do) of the elements we select, as developers. The aesthetic properties are perhaps easier to see and adjust, and in the TMS WEB Core project we’ve been creating, now called Actorious, we’ve seen how easy it is to use CSS to override the appearance of very nearly anything we want, from scrollbars to cell padding to fonts to borders. Customizing interactions for a particular element is potentially more difficult, however, and we’re generally more reliant on an element’s built-in capabilities to help us out. But a web application has enormous potential for customizations even in this area. We can add functionality and change element behaviors at will, with the goal of making the user experience as enjoyable as possible. So in this post, we’re going to explore a bunch of these kinds of enhancements, while striving for a certain level of consistency and performance, filing off some rough edges along the way. Tooltips. Let’s ease into this topic with something that seems simple enough. Tooltips. In Delphi, they’re called hints. And they work the same way straight out of the box in a TMS WEB Core application. Add a button to a form. Add something to the Hint property. Hovering your mouse over the button produces a tooltip. We’re done, right? Well, if you’ve been following along, you must know by now that we’re certainly not done at all. We’ve not even really started! When it comes to tooltips generally, there are quite a few things you can customize to make them more useful or, alternatively, to get them out of your way. The properties we’re going to address here are the overall look of the tooltip, the placement (relative to what it is linked to), as well as the delay – how quickly a tooltip appears and disappears. For some tooltips, we actually want them to be almost instant. And for others, we’d rather not see them at all most of the time. Also keep in mind that tooltips might have varying levels of usefulness under different conditions. Having a tooltip that shows “Biography” when you have a button that is clearly labeled “Biography” probably doesn’t make much sense, initially. But later, when that row of buttons shrinks to just an icon if the form is displayed on a narrower display, suddenly the tooltip might be more useful. The look of a tooltip is […]
From this article, you will learn the difference between working with databases via the ADO technology and the FireDAC library. Using the right database technology is often a critical part of designing your apps, particularly for Windows application development where there is a very rich array of database choices, not all of which may be hosted on a Windows server. ADO (ActiveX Data Objects) is an app programming interface developed by Microsoft and based on the component technology ActiveX. ADO allows providing data from different sources (relational databases, text files, etc.) in an object-oriented format. FireDAC is a universal data access library that is intended for developing apps for different devices that should be connected to corporate databases. Thanks to a universal and highly-effective architecture, FireDAC ensures high-speed direct native access from Delphi and C++Builder to InterBase, SQLite, MySQL, SQL Server, Oracle, PostgreSQL, DB2, SQL Anywhere, Advantage DB, Firebird, Access, Informix, etc. It’s important to understand that FireDAC is a library. At the same time, ADO is a global technology that ensures access not only to databases but also to texts, documents, tables, and others. In this article, we will consider the connection to MS Access and SQLite databases using both technologies, conduct data sampling and display them on the grid. How to set up a connection to MS Access databases using ADO? To get connected to the MS Access database we need to add a TADOConnection component to the form and tune it. For setting the connection we can move to the ConnectionString property in the object inspector and press the button with three dots “…” or make a double-click on the component. We will see a form where it will be required to choose an option Use Connection String and press a Build button. In the next form, it is necessary to choose Microsoft Jet 4.0 OLE DB Provider and press Next >> We will get to the next tab “Connection”. Here we need to indicate the path to the database file and click OK. Then we need to click OK once again in the window where you can see our Connection String We have only one step left. In the Object Inspector window, it is necessary to switch the LoginPrompt property to False so that after connecting to the database we won’t get a window for inserting login and password. Setting the ADO connection to active If everything is set correctly, we are able to add the Connected property to True and our component will connect to the database. But we won’t do that. The best practice is to get connected to a database during the program launch. For doing that, we can make a double-click on the form and open a code editor where we will see a procedure for a form creation event and add there one code line as you can see in the screenshot below. Then we need to add a TADOQuery component to the form and make all the settings. First of all, we need to set the Connection property. In order to do it, from the dropdown list we need to choose ADOConnection1 which has been set at the previous steps. Now in the SQL property, we will set a question for data sampling. After that let’s go back to the […]
You are familiar with FreeAndNil(), but do you use it? How often? Are you using it right? As with most things in software development, it is a complicated topic. So let’s see what the experts have to say. We are going to debate the details in a friendly discussion with some of your favorite MVPs. Webinar details: This blog post will include the replay, slides, and more after the webinar. The Survey Says… When you register for the webinar we’ve included a short survey to see where you stand on the issue. During the webinar we will compare the general consensus with that of our MVP panel of experts. The following MVPs have weighed in on the topic, register today to see what they have to say! Dalija Prasnikar Frank Lauter Uwe Raabe Paul TOTH Radek Cervinka Olaf Monien Dr. Holger Flick Patrick Prémartin Boian Mitov Matthew Vesperman Vinicius Sanchez Darian Miller Juliomar Marchetti Erik van Bilsen Allen Bauer Nick Hodges
Let’s start with building your foundation. Building backend and multiplayer infrastructure early in production is vital for our developers – like InnerSloth, Riot Games, and Fika Productions. Pick what your game needs from multiplayer tools, player data management, and in-game content publishing. Managing accounts Authentication, currently installed in more than 4,000 projects, allows you to assign an account to players and attach to them all the data generated by the backend products. Cloud Save lets you track and store player data including abilities, statistics, and more, enabling cross-device accounts for your players – the service saw over 14 million API calls over beta. “Having the ability to link Economy and Authentication in one place to achieve synchronization across devices was literally a game changer for us.” – Mike Hardy, Lead Game Designer and UI Engineer, Line Drift Enabling multiplayer Lobby enables players to come together in either private or public lobbies before joining into the core game session. Lobby is already supporting over 400 unique game projects, including both in-development and live games. Relay enables developers to build peer-to-peer games without needing to tackle the complexities of dedicated game server hosting. Relay ensures security and privacy by never requiring IPs to be shared and encrypting all game traffic with DTLS. In addition, Relay can be set up with Netcode for GameObjects (beta) for small scale co-op projects, and works out-of-the-box with Unity’s Lobby service. Today, Relay is powering more than 2,500 unique game projects.
Thanks to the best low code platforms, it is now possible to develop applications with less effort. These won’t let you burn your budget, wait for days/ months, or hire a number of engineers. Low-code platforms help firms optimize their software development process. They provide various easy visual tools. According to Gartner, 65 percent of application development projects will use low-code development by 2024.[1] The importance of applications in our daily lives is certainly unprecedented. They are crucial in both personal and professional life. Low-code platforms are a beneficial investment for many corporate users. Businesses that want to grow must find new ways to increase their production. Investing in low-code platforms could be a more current approach to this problem. What are low code platforms and what are the benefits? A low code platform allows business users to develop applications without writing code. This makes it easier to create custom applications that meet specific business needs. Low code platforms have become increasingly popular in the last few years. These platforms are useful for companies that have limited knowledge of coding. Also, for companies who don’t have the resources to hire teams of developers to build applications from scratch. Lowering the barrier to entry The biggest benefit of low code is that it lowers the barrier for entry-level software development even further. There’s no need for developers to write code. Anyone with basic skills in user interface design can create software on a low code platform. This means that businesses can build an application without having full-time developers on staff. Increased speed and agility Low code allows organizations to move faster than before. They allow less-expereinced users to create software directly from their business requirements. So, instead of designing and developing, organizations can quickly move from prototype through testing. This often happens within days or weeks instead of months. More reliable and scalable Low code platforms deliver more reliable applications. They allow users to create applications that are easy to use, easy to change, and easy to maintain. The apps created with low code platforms are easy to scale compared to ones created with traditional programming languages like Java or C++. Greater resilience and control Data is stored in the application while using standard programming languages like Java or C++. It’s still saved externally in a database or cloud storage provider like Amazon S3 or Google Cloud Storage using a low code platform. This means you may keep your data private if necessary (for example, if it contains sensitive personal information) while maintaining complete control over who has access to it. Five examples of the best low code platforms Each low code platform has a distinct approach. This raises the question, do you have to choose one, or are there multiple platforms that you can select from? Here are the top 5 low code platforms that you can choose. 1. RAD Studio RAD Studio is a software development suite. It enables developers to create software for Windows, macOS, iOS, Android, and Linux. Development environment The RAD Studio development environment is easy to use. It provides all the tools to develop cross-platform applications. It includes a code editor, Integrated Development Environment (IDE), database tools, web server, database connectivity, reporting tools, etc. You can build desktop apps with native controls by using C++ […]
Invormațiile pe cale Dvs le introduceți în prezentul formular nu se păstrează online, dar se vor transmite direct la destinație. Mai multe informații găsiți în Politica Noastră de Confidentialitate
We use cookies to ensure that we give you the best experience on our website. If you continue to use this site we will assume that you are happy with it.