The Parallel Debugger plugin is now available for RAD Studio 11!
 The Parallel Debugger plugin, originally from Parnassus, is now available in GetIt for RAD Studio 11.x (ie 11.0 and 11.1.) This follows up making Bookmarks and Navigator available a few weeks ago.
The Parallel Debugger is an addon that lets you see what’s going on in all threads in your app at once. A traditional debugger in the IDE shows only one thread, one call stack, and so forth. The plugin shows you all call stacks for all threads next to each other (ie visually parallel matching that they are running in parallel), adds markup in the editor showing where each thread is executing, color-codes threads, lets you run, step or trace into on a per-thread basis, and more. Read the original announcement blog post to see the full set of features!
 Screenshot showing some of the Parallel Debugger features: parallel call stacks, coloured threads, extra editor markup, per-thread run/pause/step/trace, etc
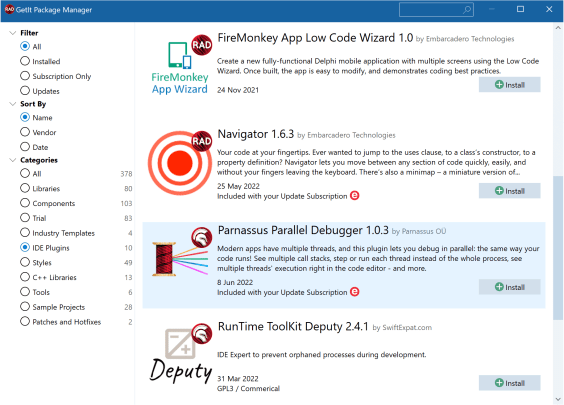
To install, go to the Tools menu in the IDE, GetIt Package Manager, and select the IDE Plugins section in the category selector on the left. You’ll see it listed: select it and click Install.
 The Parallel Debugger selected in GetIt. Note there are many other IDE addons in the same category too!
The Debugger plugin does stress the various debuggers, because each of them is doing so much more (roughly linearly increased by the number of threads in your app.) It works best on Windows, and we don’t recommend using it for remote debugging, such as for macOS. It adds a new top-level menu called Thread, and in that is a submenu ‘Feature Level’. Keep that on ‘CPU Only’ when you don’t want the Parallel Debugger heavily involved. Then turn it back on when you need to do some debugging in parallel!
We hope you find this useful, and helps you debug and understand your app’s parallel actions.


