Introducing CMake Debugger in VS Code: Debug your CMake Scripts using Open-Source CMake Debugger
Introducing CMake Debugger in VS Code: Debug your CMake Scripts using Open-Source CMake Debugger
The new CMake Debugger that was introduced in Visual Studio is now available in VS Code. Now, you can debug your CMakeLists.txt scripts from VS Code using the CMake Tools Extension. To see the full release notes for this release and what else is included, including bug fixes, please see the release notes.
Background
The Visual C++ team collaborated closely with Kitware, the CMake maintainers, to merge our CMake debugger implementation upstream and make this widely available. This implementation is now available in CMake version 3.27. Please download the latest version for your OS via this link or update via your system package manager to access the CMake debugger in VS Code. You can check your CMake version on your machine at any time by running cmake –version in a terminal window. CMake 3.27 will ship with Visual Studio in a later release in 17.8.
The debugger uses the widely supported Debug Adapter Protocol, which is compatible with many development environments. We are excited to see how the open-source community works together to implement new ideas for the debugger.
CMake Debugger Functionality
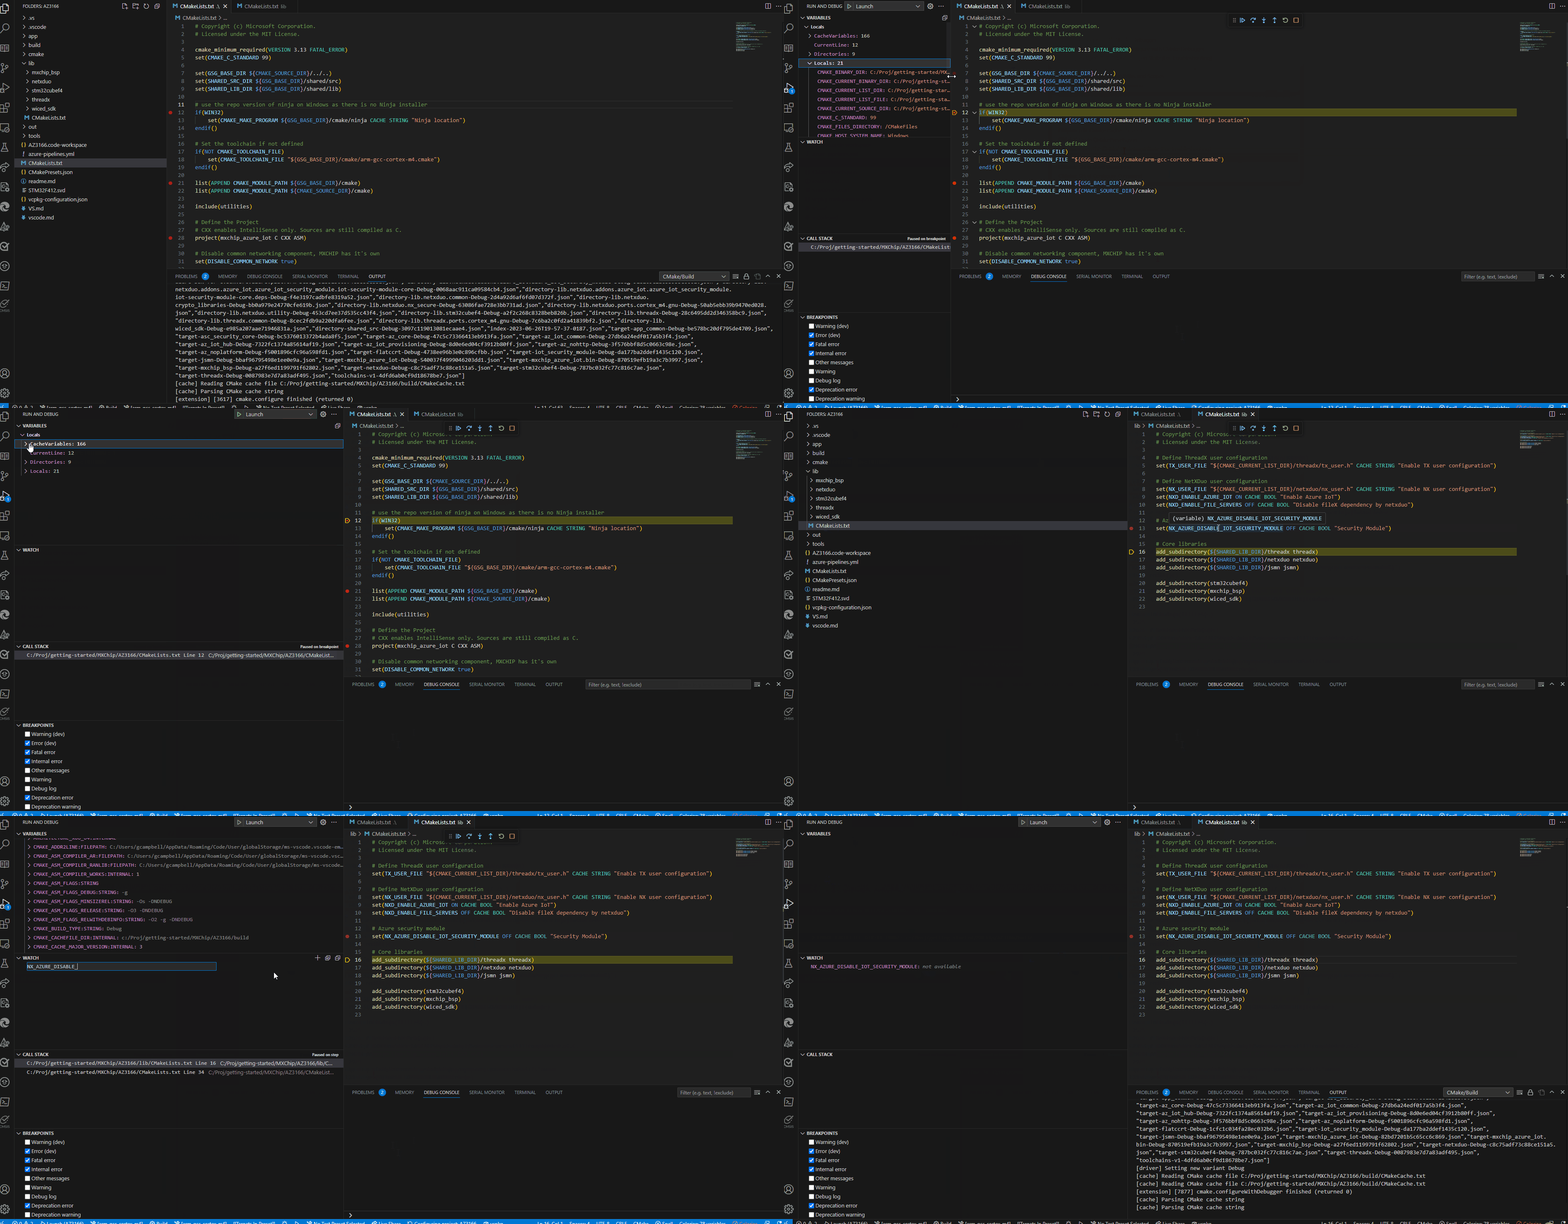
As a user, you’ll see the same functionality as you would in a normal debugging session. This includes viewing variables, call stacks, and cache variables specific to CMake and the ability to set breakpoints on your CMakeLists.txt file and step through your code.
To open the CMake Debugger in your project, you can select it from the command palette by pressingCtrl+Shift+P.
Additionally, it can be opened anywhere else you typically configure your project, such as in the CMake Project Outline in the CMake Tools side panel.
If your CMake configure ever fails, a notification will pop-up for you to interact with to launch the debugger.
What’s next?
Next up, we are working on a few different things including implementing CMake language services and re-vamping our overall CMake side panel and status bar experiences based on user feedback. Let us know what else you’d like to see!
Send us your feedback!
We hope this helps your CMake workflows in VS Code. Download the latest preview version of Visual Studio and give it a try. Download the CMake Tools extension for Visual Studio Code and let us know what you think. We would love to see what you contribute to our repo and are active on reviews and collaboration. If you have any issues, please file an issue to our repo here. Comment below or reach us via email at visualcpp@microsoft.com or via Twitter at @VisualC.


