
SBOM Explained: Your 2026 Software Supply Chain Security Guide
Understand Software Bill of Materials (SBOM) in 2026. Enhance security, manage risks, and ensure compliance with this essential guide.
Understand Software Bill of Materials (SBOM) in 2026. Enhance security, manage risks, and ensure compliance with this essential guide.

Understand the critical role of a Software Bill of Materials (SBOM) in 2026 for software supply chain security, vulnerability management, and compliance. Learn what it is and why it’s vital.

In 2026, the digital landscape faces unprecedented cyber threats, with software supply chain attacks escalating by an estimated 30% year-over-year.

Master C++ compilation in 2026. Discover top C++ compilers and why C++Builder offers an optimized, integrated development experience.
In 2026, the digital landscape faces unprecedented threats, with web applications serving as primary targets for cyberattacks. A staggering 90% of all cyberattacks target web applications, highlighting the critical need for robust security solutions. DerScanner emerges as a leading force in this domain, offering advanced capabilities to detect and mitigate vulnerabilities before they can be exploited. This comprehensive guide explores DerScanner’s technology, its benefits, and how it empowers organizations to achieve superior web application security. What is DerScanner Web Application Security? DerScanner is an advanced security solution designed to identify vulnerabilities within web applications. It employs a multi-layered approach, combining static and dynamic analysis techniques with AI-driven threat intelligence. Unlike traditional scanners, DerScanner offers deeper insights into application logic and potential weaknesses that attackers might exploit. Its core mission is to provide developers and security teams with actionable intelligence to build and maintain secure applications. The platform focuses on a wide array of security flaws, including but not limited to: DerScanner’s comprehensive vulnerability coverage ensures that applications are scrutinized against the latest threat vectors and established security best practices. How Does DerScanner Work? DerScanner utilizes a sophisticated engine that analyzes web applications from multiple perspectives. Its process begins with a thorough understanding of the application’s architecture, followed by in-depth vulnerability detection. Static Application Security Testing (SAST) DerScanner’s SAST capabilities analyze the application’s source code without executing it. This method allows for the early detection of vulnerabilities during the development lifecycle. This proactive approach helps catch vulnerabilities early, significantly reducing the cost and effort required for remediation compared to finding them in production. Dynamic Application Security Testing (DAST) Complementing SAST, DerScanner’s DAST capabilities test the application in its running state. This approach mimics how an attacker would interact with the application. By combining SAST and DAST, DerScanner provides a holistic view of an application’s security posture, covering vulnerabilities that might be missed by either method in isolation. AI-Powered Threat Intelligence A key differentiator for DerScanner is its integration of Artificial Intelligence (AI) and Machine Learning (ML). This AI-driven approach enhances the accuracy and efficiency of vulnerability detection. The AI component transforms DerScanner from a simple vulnerability scanner into an intelligent security assistant. Key Features and Benefits of DerScanner DerScanner offers a robust set of features designed to meet the evolving demands of modern application security. Comprehensive Vulnerability Coverage DerScanner tests for a vast range of vulnerabilities, adhering to industry standards like the OWASP Top 10. This ensures that applications are protected against the most common and impactful threats. Its detailed reporting provides clear explanations of each vulnerability, its potential impact, and recommended remediation steps. Developer-Centric Workflow Integration DerScanner is built with developers in mind. It integrates seamlessly into popular CI/CD pipelines, allowing security testing to become an automated part of the development process. This integration fosters a culture of “security as code,” empowering developers to fix vulnerabilities early and efficiently. For instance, understanding how to develop applications for platforms like Raspberry Pi with tools like Delphi 11, as explored in How To Develop Applications For The Raspberry Pi With Delphi 11, requires secure coding practices from the outset. Accurate and Actionable Reporting DerScanner provides clear, concise, and actionable reports. Each vulnerability is detailed with: This detailed reporting enables security teams and developers to quickly understand and address identified risks. Scalability and Performance […]
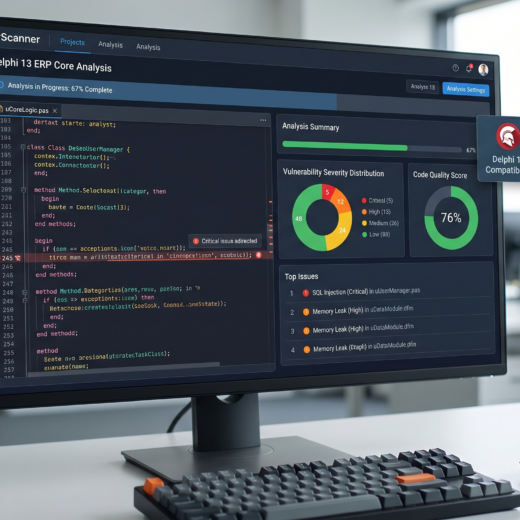
In 2026, securing Delphi applications is paramount, with DerScanner emerging as a vital tool for Delphi application security. Recent reports indicate that over 40% of software vulnerabilities stem from insecure coding practices, making proactive security analysis essential. DerScanner offers a robust solution for identifying and mitigating these risks within Delphi environments, ensuring the integrity and safety of your applications. This comprehensive guide explores DerScanner’s capabilities, its impact on Delphi application security, and best practices for its implementation. Understanding the Threat Landscape for Delphi Applications Delphi, a powerful Integrated Development Environment (IDE) for Object Pascal, has been a cornerstone for developing native applications across various platforms for decades. However, like any software development platform, applications built with Delphi are susceptible to security vulnerabilities. These vulnerabilities can range from common issues like SQL injection and cross-site scripting (XSS) – even in desktop applications through embedded web components or data interactions – to more specific weaknesses related to the Delphi runtime or its libraries. The threat landscape is constantly evolving. Attackers are increasingly sophisticated, targeting not just web applications but also desktop and mobile applications. Data breaches, intellectual property theft, and service disruptions are significant risks. For businesses relying on Delphi applications, a security lapse can lead to severe financial losses, reputational damage, and loss of customer trust. Therefore, understanding these threats is the first step toward effective defense. Common Vulnerabilities in Delphi Applications Several types of vulnerabilities can plague Delphi applications if not properly addressed during development: The Importance of Proactive Security Waiting for a vulnerability to be exploited is a reactive and often costly approach. Proactive security measures, integrated throughout the Software Development Life Cycle (SDLC), are far more effective. This involves identifying potential weaknesses early in the development process, allowing for their remediation before they become exploitable flaws. Static Application Security Testing (SAST) tools, like DerScanner, play a crucial role in this proactive strategy. Introducing DerScanner: A Powerful SAST Solution DerScanner is a cutting-edge Static Application Security Testing (SAST) tool designed to analyze source code for security vulnerabilities without executing the application. It scans your Delphi codebase, identifying potential security flaws, coding errors, and compliance issues. By examining the code structure, data flow, and control flow, DerScanner provides developers with actionable insights to enhance application security. The tool’s primary objective is to empower development teams to build more secure software from the ground up. It integrates seamlessly into the development workflow, enabling early detection and remediation of vulnerabilities, thus reducing the cost and complexity associated with fixing security issues later in the lifecycle or, worse, after deployment. How DerScanner Works DerScanner employs sophisticated analysis techniques to scrutinize your Delphi source code. Its core functionalities include: This multi-layered analysis allows DerScanner to detect a wide array of security issues, from simple coding errors to complex logical vulnerabilities. Key Features of DerScanner DerScanner stands out due to its robust feature set tailored for modern development needs: Enhancing Delphi Application Security with DerScanner Implementing DerScanner into your development workflow can significantly bolster the security posture of your Delphi applications. The tool acts as an essential layer of defense, complementing other security practices like secure coding training and dynamic analysis. Integrating DerScanner into the SDLC The most effective way to leverage DerScanner is by integrating it at multiple stages of the Software Development Life Cycle (SDLC): Addressing Specific […]

I. Introducere: Plafonul Automatizării în 2026 În peisajul tehnologic al anului 2026, industria de software din România a atins un punct de inflexiune critic. După ani în care „Automation Engineer” a fost unul dintre cele mai căutate roluri în hub-urile tech din București, Cluj sau Iași, realitatea crudă a lovit fluxurile de lucru: automatizarea tradițională a atins un plafon de eficiență. Deși am reușit să convertim procesele manuale în scripturi, am creat, fără să vrem, un nou „monstru” tehnologic: datoria de mentenanță. Paradoxul progresului în 2026 este evident. Pe măsură ce echipele de dezvoltare adoptă instrumente de generare a codului prin AI, volumul de funcționalități noi livrate săptămânal a crescut exponențial. Scripturile de testare deterministe (bazate pe Selenium sau versiuni timpurii de Playwright) pur și simplu nu mai pot ține pasul. Acestea sunt rigide, se „rup” la cea mai mică modificare de UI și necesită intervenție umană constantă pentru actualizare. În acest context, testarea automatizată a devenit, ironic, blocajul principal în calea livrării continue. The Intelligence Leap (Saltul de Inteligență) reprezintă tranziția fundamentală de la execuția oarbă a unor instrucțiuni predefinite la Testarea Autonomă. Dacă automatizarea este despre execuție, autonomia este despre decizie. În 2026, nu mai vorbim despre dacă un test trece sau pică, ci despre sisteme care înțeleg intenția din spatele codului. Această evoluție este esențială pentru Stack-urile de Dezvoltare moderne, unde complexitatea microserviciilor și viteza impusă de piață transformă mentenanța manuală a testelor într-o activitate nesustenabilă din punct de vedere financiar și operațional. Companiile care nu fac trecerea spre soluții autonome riscă să rămână captive într-un ciclu infinit de „bug-fixing” pentru scripturile de testare, în timp ce concurența inovează la viteza luminii. II. Arhitectura Autonomiei: Dincolo de Scripturi Cuvinte cheie: Agentic QA, Self-healing Tests, Generative Test Data, Playwright AI, Arhitectură QA, Machine Learning. Arhitectura testării autonome în 2026 nu este doar o versiune mai rapidă a vechilor framework-uri; este o schimbare de paradigmă la nivel de infrastructură. Inima acestei noi arhitecturi este conceptul de Agentic QA. Spre deosebire de un script tradițional care caută un element după un ID static (care se poate schimba la fiecare build), agenții autonomi de testare utilizează rețele neuronale pentru a procesa interfața vizual și structural, exact cum ar face-o un utilizator uman, dar cu precizie computațională. 1. Locatori Bazat pe Intenție și Self-Healing Pilonul central al arhitecturii autonome este capacitatea de Auto-Vindecare (Self-Healing). Atunci când un dezvoltator modifică structura unui DOM sau schimbă un flux de checkout pentru a îmbunătăți experiența utilizatorului, testele autonome nu se mai blochează. Agentul analizează modificarea, înțelege că butonul de „Finalizare Comandă” a fost mutat sau redenumit și își actualizează singur logica de identificare în timp real. Această abordare bazată pe „intenție” elimină 80% din alarmele false care parazitau fluxurile CI/CD în trecut. 2. Generarea Dinamică a Datelor de Test În 2026, confidențialitatea datelor (GDPR) și complexitatea scenariilor de business fac imposibilă utilizarea datelor de producție anonimizate manual. Arhitectura autonomă include un strat de Generative Test Data, care creează seturi de date sintetice, dar hiper-realiste, adaptate contextului specific al fiecărui test. Dacă testăm un flux bancar complex pentru un client din zona de Fintech din România, sistemul generează automat istorice de tranzacții, profile de risc și variabile de mediu care simulează condiții de stres extrem, fără nicio intervenție umană. 3. Knowledge Graphs și Înțelegerea Contextului Spre […]

În ultimii ani, inteligența artificială a promis o revoluție în dezvoltarea software, însă realitatea din teren a scos la iveală o problemă neașteptată: „Paradoxul AI”. Deși dezvoltatorii scriu cod mai rapid cu ajutorul asistenților generativi, viteza de livrare a produselor finite nu a crescut proporțional. Motivul? Codarea reprezintă doar 20% din munca unui programator. Restul de 80% este blocat în procese de planificare, securitate, recenzii de cod și depanare. Lansarea generală a GitLab Duo Agent Platform marchează sfârșitul acestei ere a câștigurilor incrementale. Nu mai vorbim despre un simplu chatbot, ci despre o platformă integrată de agenți AI capabili să execute sarcini complexe în mod autonom, transformând întregul ciclu de viață al dezvoltării software (SDLC). Ce este GitLab Duo Agent Platform? GitLab Duo Agent Platform este prima soluție de tip „Agentic AI” creată special pentru mediul enterprise, care unifică inteligența artificială cu fluxurile de lucru DevSecOps. Spre deosebire de instrumentele AI tradiționale care oferă doar sugestii pasive, această platformă utilizează agenți software care pot „raționa”, pot lua decizii și pot executa acțiuni multi-pas pe baza contextului complet al proiectului tău. De ce este nevoie de o platformă agentică acum? Echipele de inginerie se confruntă cu un volum de muncă fără precedent. Creșterea vitezei de scriere a codului a dus, paradoxal, la blocaje în aval: GitLab Duo Agent Platform rezolvă aceste provocări prin orchestrare inteligentă, acționând ca un multiplicator de forță pentru fiecare membru al echipei. Caracteristici Cheie: Cum funcționează GitLab Duo Agent Platform 1. Agentic Chat: Dincolo de conversațiile simple Inima platformei este noul Agentic Chat. Acesta nu se limitează la a răspunde la întrebări teoretice. Datorită accesului la contextul complet din GitLab — inclusiv issue-uri, merge requests (MRs), pipeline-uri și rezultate de securitate — Agentic Chat poate: 2. Agenții Fundaționali: Specialiștii tăi 24/7 Platforma include agenți pre-construiți de experții GitLab pentru cele mai critice sarcini: 3. AI Catalog și Agenți Personalizați Fiecare organizație are propriile standarde de inginerie. Prin intermediul AI Catalog, echipele pot crea și partaja proprii agenți personalizați. Aceștia pot fi instruiți să urmeze regulile specifice de conformitate sau stilul de codare al companiei tale, asigurând un nivel de consistență imposibil de atins manual. 4. Integrarea cu Modele Externe (Anthropic, OpenAI) GitLab Duo Agent Platform este agnostică din punct de vedere al modelului. Poți utiliza puterea unor instrumente de top precum Claude Code (Anthropic) sau Codex CLI (OpenAI) direct din interfața GitLab, beneficiind în același timp de securitatea și guvernanța oferite de platformă. Impactul asupra Productivității: Cifre și Viziune Conform datelor colectate, dezvoltatorii care folosesc AI raportau deja creșteri de productivitate la nivel de codare. Însă, cu GitLab Duo Agent Platform, obiectivul este accelerarea „Velocity of Innovation” (viteza inovației). Etapa SDLC Metodă Tradițională Cu GitLab Duo Agent Platform Planificare Ore de ședințe și documentare Generare automată de tichete de către Planner Agent Securitate Verificări manuale post-factum Scanare și remediere asistată în timp real Code Review Așteptare de zile pentru feedback Analiză AI-native instantanee pentru erori logice Depanare CI/CD Căutare manuală în log-uri Identificare automată a cauzei eșecului Arhitectura și Securitatea: Pilonii GitLab Duo Agent Platform Într-un mediu enterprise, securitatea datelor este nenegociabilă. GitLab a construit această platformă pe principiul transparenței și controlului total. Model Selection Framework Administratorii au puterea de a alege ce Large Language Model (LLM) doresc să folosească. Poți opta pentru: Guvernanță și Conformitate Toate […]

Why Build AI/ML Pipelines in C++ and CUDA? C++ is great at giving direct access to memory, compute graphs, and system resources. This control helps engineers build predictable pipelines for latency-sensitive workloads. You get full visibility into every allocation, transfer, and kernel call. Each step becomes easy to inspect and refine. You control how the pipeline performs at a very deep level. CUDA enables GPU-accelerated machine learning with massive thread parallelism. CUDA reveals how the GPU is built, from blocks to threads and warps. You see exactly how work moves across the hardware. This lets developers write kernels that push each SM to its maximum throughput. Python adds interpreter overhead, random GC pauses, and unpredictable latency spikes. Production inference pipelines cannot afford unpredictable stalls. C++ GPU programming for AI avoids these problems and keeps timing stable. Most of the industries, like autonomous vehicles, robotics, medical imaging, and high-frequency trading, rely on CUDA machine learning pipelines. Their products demand real-time performance, and C++ provides it. GPU-accelerated machine learning becomes essential when milliseconds matter. The C++ CUDA machine learning stack gives engineers full control over kernels, streams, and memory. This combination powers the fastest ML infrastructure in the world. Architecture of a High-Performance ML Pipeline A strong C++ CUDA machine learning pipeline requires multiple components working together efficiently. Each stage loads data, transforms it, and moves tensors into training or inference. CUDA tensor operations run throughout this flow to keep things fast. The design must reduce overhead and avoid any useless steps. Data Loading and Preprocessing Data loading often becomes the first bottleneck. GPU-accelerated transforms reduce CPU pressure and keep the GPU fed. Zero-copy memory transfers allow the GPU to read host memory without copying. CUDA streams help overlap preprocessing and computation. The GPU processes one batch while another batch loads. This design keeps the hardware fully utilized. Preprocessing must stay lightweight and predictable. Slow preprocessing can freeze the whole pipeline. It leaves the GPU waiting with nothing to do. Good design keeps those cycles busy. Code Example: cudaMalloc + cudaMemcpy Feature Engineering and Tensor Preparation Feature engineering often needs custom kernels. These kernels implement domain-specific transforms that generic libraries cannot. CUDA gives developers the ability to tune memory access patterns for higher throughput. Coalesced memory access reduces memory transactions. When threads read data sequentially, the GPU handles fewer requests. This pattern becomes essential for C++ CUDA machine learning pipelines. Warp divergence slows down execution. Branch-heavy kernels cause warps to serialize. Engineers avoid branching when building tensor operations. Model Training Training relies on massive matrix operations. These operations run best through optimized CUDA libraries like cuBLAS and cuDNN. They exploit hardware features better than handwritten kernels. Forward and backward passes rely on fused kernels. Fusion avoids unnecessary memory reads and writes. This optimization has huge effects on performance. TensorRT, tiny-cuda-nn, and CUTLASS show why C++ for machine learning is powerful. They let teams build custom training loops without heavy boilerplate. They save time and keep performance strong. Code Example: cuBLAS Matrix Multiply Inference Pipeline Inference must choose between real-time mode and batch mode. Real-time mode minimizes latency, while batch mode increases throughput. Production teams decide based on product requirements. Pinned memory reduces transfer latency. It prevents the OS from paging memory and speeds up host-to-device movement. Memory pooling avoids repeated allocation overhead. CUDA graphs […]

Why 2026 is the Year of the Delphi AI Agent For decades, the Delphi community has prided itself on the “Power of the Language” and the efficiency of its Visual Component Library (VCL). However, as the software industry moved toward AI-driven development, many felt that general-purpose tools like GitHub Copilot and Cursor were leaving Object Pascal behind. These tools often hallucinated syntax or failed to understand the unique link between a .pas unit and its visual .dfm counterpart. Enter Delphi CodeBot. Announced in late 2025 and moving into its most significant public phase in January 2026, CodeBot is a specialized AI Coding Agent designed by David Millington (formerly of Embarcadero) and the team at RemObjects. This is not just a chatbot in a side panel; it is a context-aware powerhouse that understands the soul of Delphi development. In this definitive guide, we explore how CodeBot is redefining what it means to be a Delphi programmer in 2026. What is Delphi CodeBot? More Than Just Autocomplete Most AI tools act as “stochastic parrots,” predicting the next token based on a massive dataset of mostly C-style languages. RemObjects CodeBot is different. It is an “Agentic” system, meaning it can reason about tasks, plan multi-step solutions, and execute changes across multiple files in your project. The Architecture of a Delphi-First AI At its core, CodeBot leverages state-of-the-art LLMs (including GPT-4o and Claude 3.5/4), but it applies a “Delphi Filter.” It understands: Core Features That Empower Developers 1. “Thorough” vs. “Vibe It” Modes CodeBot introduces a philosophy of “Intentional Coding” through two primary modes: 2. VCL to FireMonkey (FMX) Migration One of the most significant “pain points” for enterprise Delphi shops is the migration from legacy Windows-only VCL apps to the cross-platform FireMonkey framework. Delphi CodeBot automates the heavy lifting. It can scan a VCL form, identify Windows-specific API calls, and suggest FMX-compliant alternatives. It doesn’t just copy the code; it translates the intent of the UI for macOS, iOS, and Android. 3. Language Translation and Integration In 2026, the ability to leverage libraries from other ecosystems is vital. CodeBot allows you to: Solving the “Cursor Problem” for Delphi Many developers tried using Cursor (the AI-powered VS Code fork) for Delphi, but the results were often “monumental garbage,” as some community leaders put it. This happened because Cursor cannot “see” the DFM (Delphi Form) files effectively. Delphi CodeBot solves this by being a native IDE plugin. It understands the relationship between the visual components and the source. If you ask it to “Add a search bar that filters the grid,” CodeBot knows it needs to add a TEdit, a TStringGrid (or TDBGrid), and wire the OnChange event—all while respecting the layout constraints of the form. Case Study: Building a Maze Generator in 5 Minutes During the January 2026 webinar, David Millington showcased CodeBot’s ability to build an application from scratch. The Technical Edge: RemObjects Island/Delphi A key technical detail often overlooked is that CodeBot is powered by RemObjects Island technology. This allows it to bridge the gap between different compilers. Whether you are using the standard Embarcadero compiler or the RemObjects Elements compiler, CodeBot ensures 100% binary compatibility. This is particularly useful for developers who want to use Delphi APIs on platforms like Linux or WebAssembly where the standard compiler support might vary. Why […]
