Structured Diagnostics in the New Problem Details Window
Structured Diagnostics in the New Problem Details Window
Massive compiler errors which seem impossible to navigate are the bane of many C++ developers’ lives. It’s up to tools to provide a better experience to help you comprehend diagnostics and understand how to fix the root issue. I wrote Concepts Error Messages for Humans to explore some of the design space and now, due to the hard work of many folks working on Visual Studio, we have a better experience to share with you all. You can read about some of the work which has led up to these changes in Xiang Fan’s blog post on the future of C++ diagnostics in MSVC and Visual Studio.
In Visual Studio 2022 version 17.8 Preview 3, if you run a build using MSVC and an MSBuild project, entries in the Error List which have additional information available will show an icon in a new column named Details:

If you click this button, a new Problem Details window will open up. By default this will be in the same place as the Error List, but if you move it around, Visual Studio will remember where you put it.
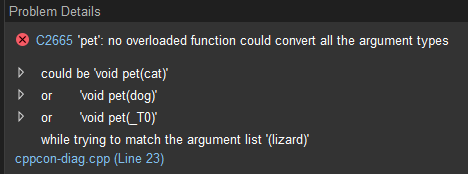
This Problem Details window provides you with detailed, structured information about why a given problem occurred. If we look at this information we might think, okay, why could void pet(dog) not be called? If you click the arrow next to it, you can see why:
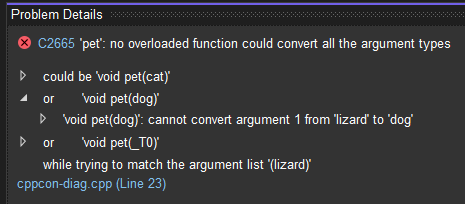
In a similar way we can expand out other arrows to find out more information about our errors. This example is produced from code which uses C++20 Concepts and the Problem Details window gives you a way to understand the structure of Concepts errors.
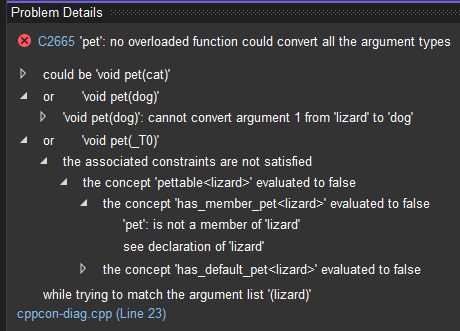
For those who would like to play around with this example, the code required to produce these errors is:
struct dog {};
struct cat {};

void pet(dog);
void pet(cat);

template
concept has_member_pet = requires(T t) { t.pet(); };

template
concept has_default_pet = T::is_pettable;

template
concept pettable = has_member_pet or has_default_pet;

void pet(pettable auto t);

struct lizard {};

int main() {
    pet(lizard{});
}
Make sure you compile with /std:c++20 to enable Concepts support.
Output Window
As part of this work we have also made the Output Window visualize any hierarchical structure in the output diagnostics. For example, here in an excerpt produced by building the previous example:
1>Source.cpp(18,6):
1>or       'void pet(_T0)'
1>Source.cpp(23,5):
1>the associated constraints are not satisfied
1>	Source.cpp(18,10):
1>	the concept 'pettable' evaluated to false
1>		Source.cpp(16,20):
1>		the concept 'has_member_pet' evaluated to false
1>			Source.cpp(10,44):
1>			'pet': is not a member of 'lizard'
1>			Source.cpp(20,8):
1>			see declaration of 'lizard'
1>		Source.cpp(16,41):
1>		the concept 'has_default_pet' evaluated to false
1>			Source.cpp(13,30):
1>			'is_pettable': is not a member of 'lizard'
1>			Source.cpp(20,8):
1>			see declaration of 'lizard'
This change makes it much easier to scan large sets of diagnostics without getting lost.
Code Analysis
The Problem Details window is now also used for code analysis warnings which have associated Key Events. For example, consider this code which could potentially result in a use-after-move:
#include
void eat_string(std::string&&);
void use_string(std::string);
void oh_no(bool should_eat, bool should_reset) {
    std::string my_string{ "meow" };
    bool did_reset{ false };

    if (should_eat) {
        eat_string(std::move(my_string));
    }

    if (should_reset) {
        did_reset = true;
        my_string = "the string is reset";
    }

    if (did_reset && !should_reset) {
        eat_string(std::move(my_string));
    }

    use_string(my_string);
}
In the case that should_eat is true and should_reset is false, my_string will be used after being moved, likely resulting in undesirable behaviour.
Fortunately, our static analyzer catches this issue, creating an entry in the Error List:

See that icon in the Details column? That means there’s extra information. Let’s have a look:
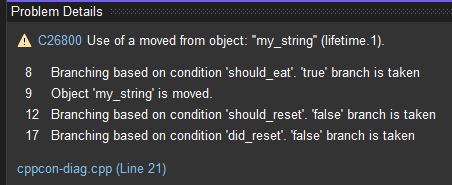
This tells us the process which the static analyzer followed to reach its conclusion that a moved-from object may be used in this program. For a small function like this we likely could have worked this out ourselves, but for larger or more complex functions, Key Events can help you understand why you’re getting a warning for your code.
You can learn more about Key Events in Hwi-Sung Im’s blog post on code analysis warnings with Key Events.
Configuration
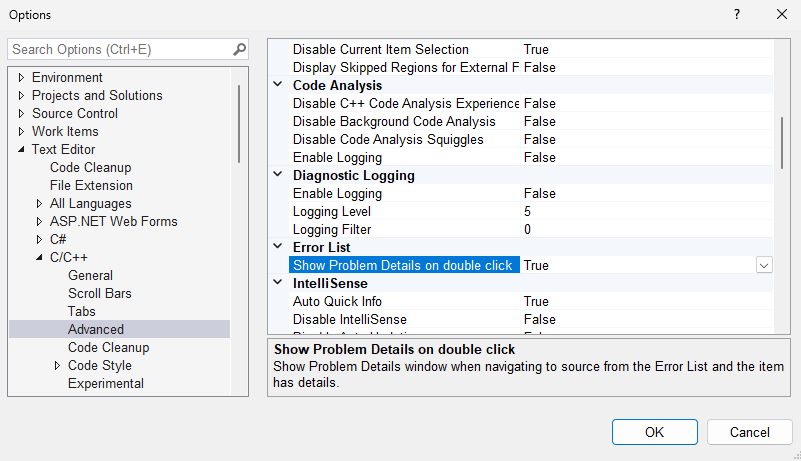
By default, the Problem Details window will also open when you double click or press enter on an Error List entry which has associated details. This can be configured at Tools > Options > Text Editor > C/C++ > Advanced > Error List > Show Problem Details on double click.
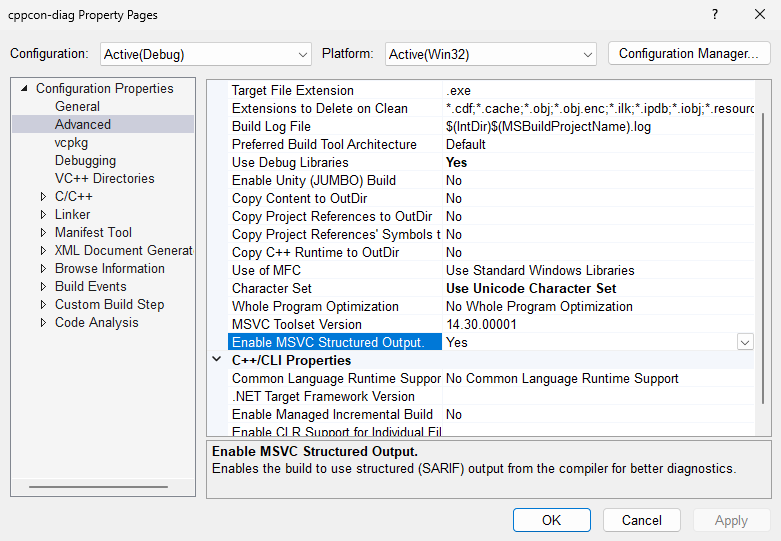
The entire feature can be enabled or disabled at Project > Properties > Advanced > Enable MSVC Structured Output. You can affect several projects by creating a Directory.Build.props file with the UseStructuredOutput property defined to true or false.
How it Works
This work leverages the SARIF (Static Analysis Results Interchange Format) standard. This is a JSON-based format for expressing diagnostics in a structured way which enables the compiler to preserve the hierarchy inherent in many diagnostics when sending information to the IDE.
No additional compiler flags are required for accessing the new experience, but if you want the compiler to produce diagnostics in SARIF in order to use the results with external tools, you can pass the /experimental:log flag to MSVC.
Call for action
Please install the latest Visual Studio 2022 Preview to try out the new diagnostics experience. After you’ve tried it, please let us know what you think through e-mail at visualcpp@microsoft.com.
If you encounter other problems with VS 2022 please let us know via the Report a Problem option, either from the installer or the Visual Studio IDE itself. For suggestions or bug reports, let us know through DevComm.


